

Resources
Delve into our comprehensive resource library, featuring an extensive collection of expert articles and videos, all dedicated to the intricacies and innovations of the DDI industry.
News — Blog — Digital Events — One-Pagers
News
News


Blog
Blog


Digital Events
Featured


One-Pagers
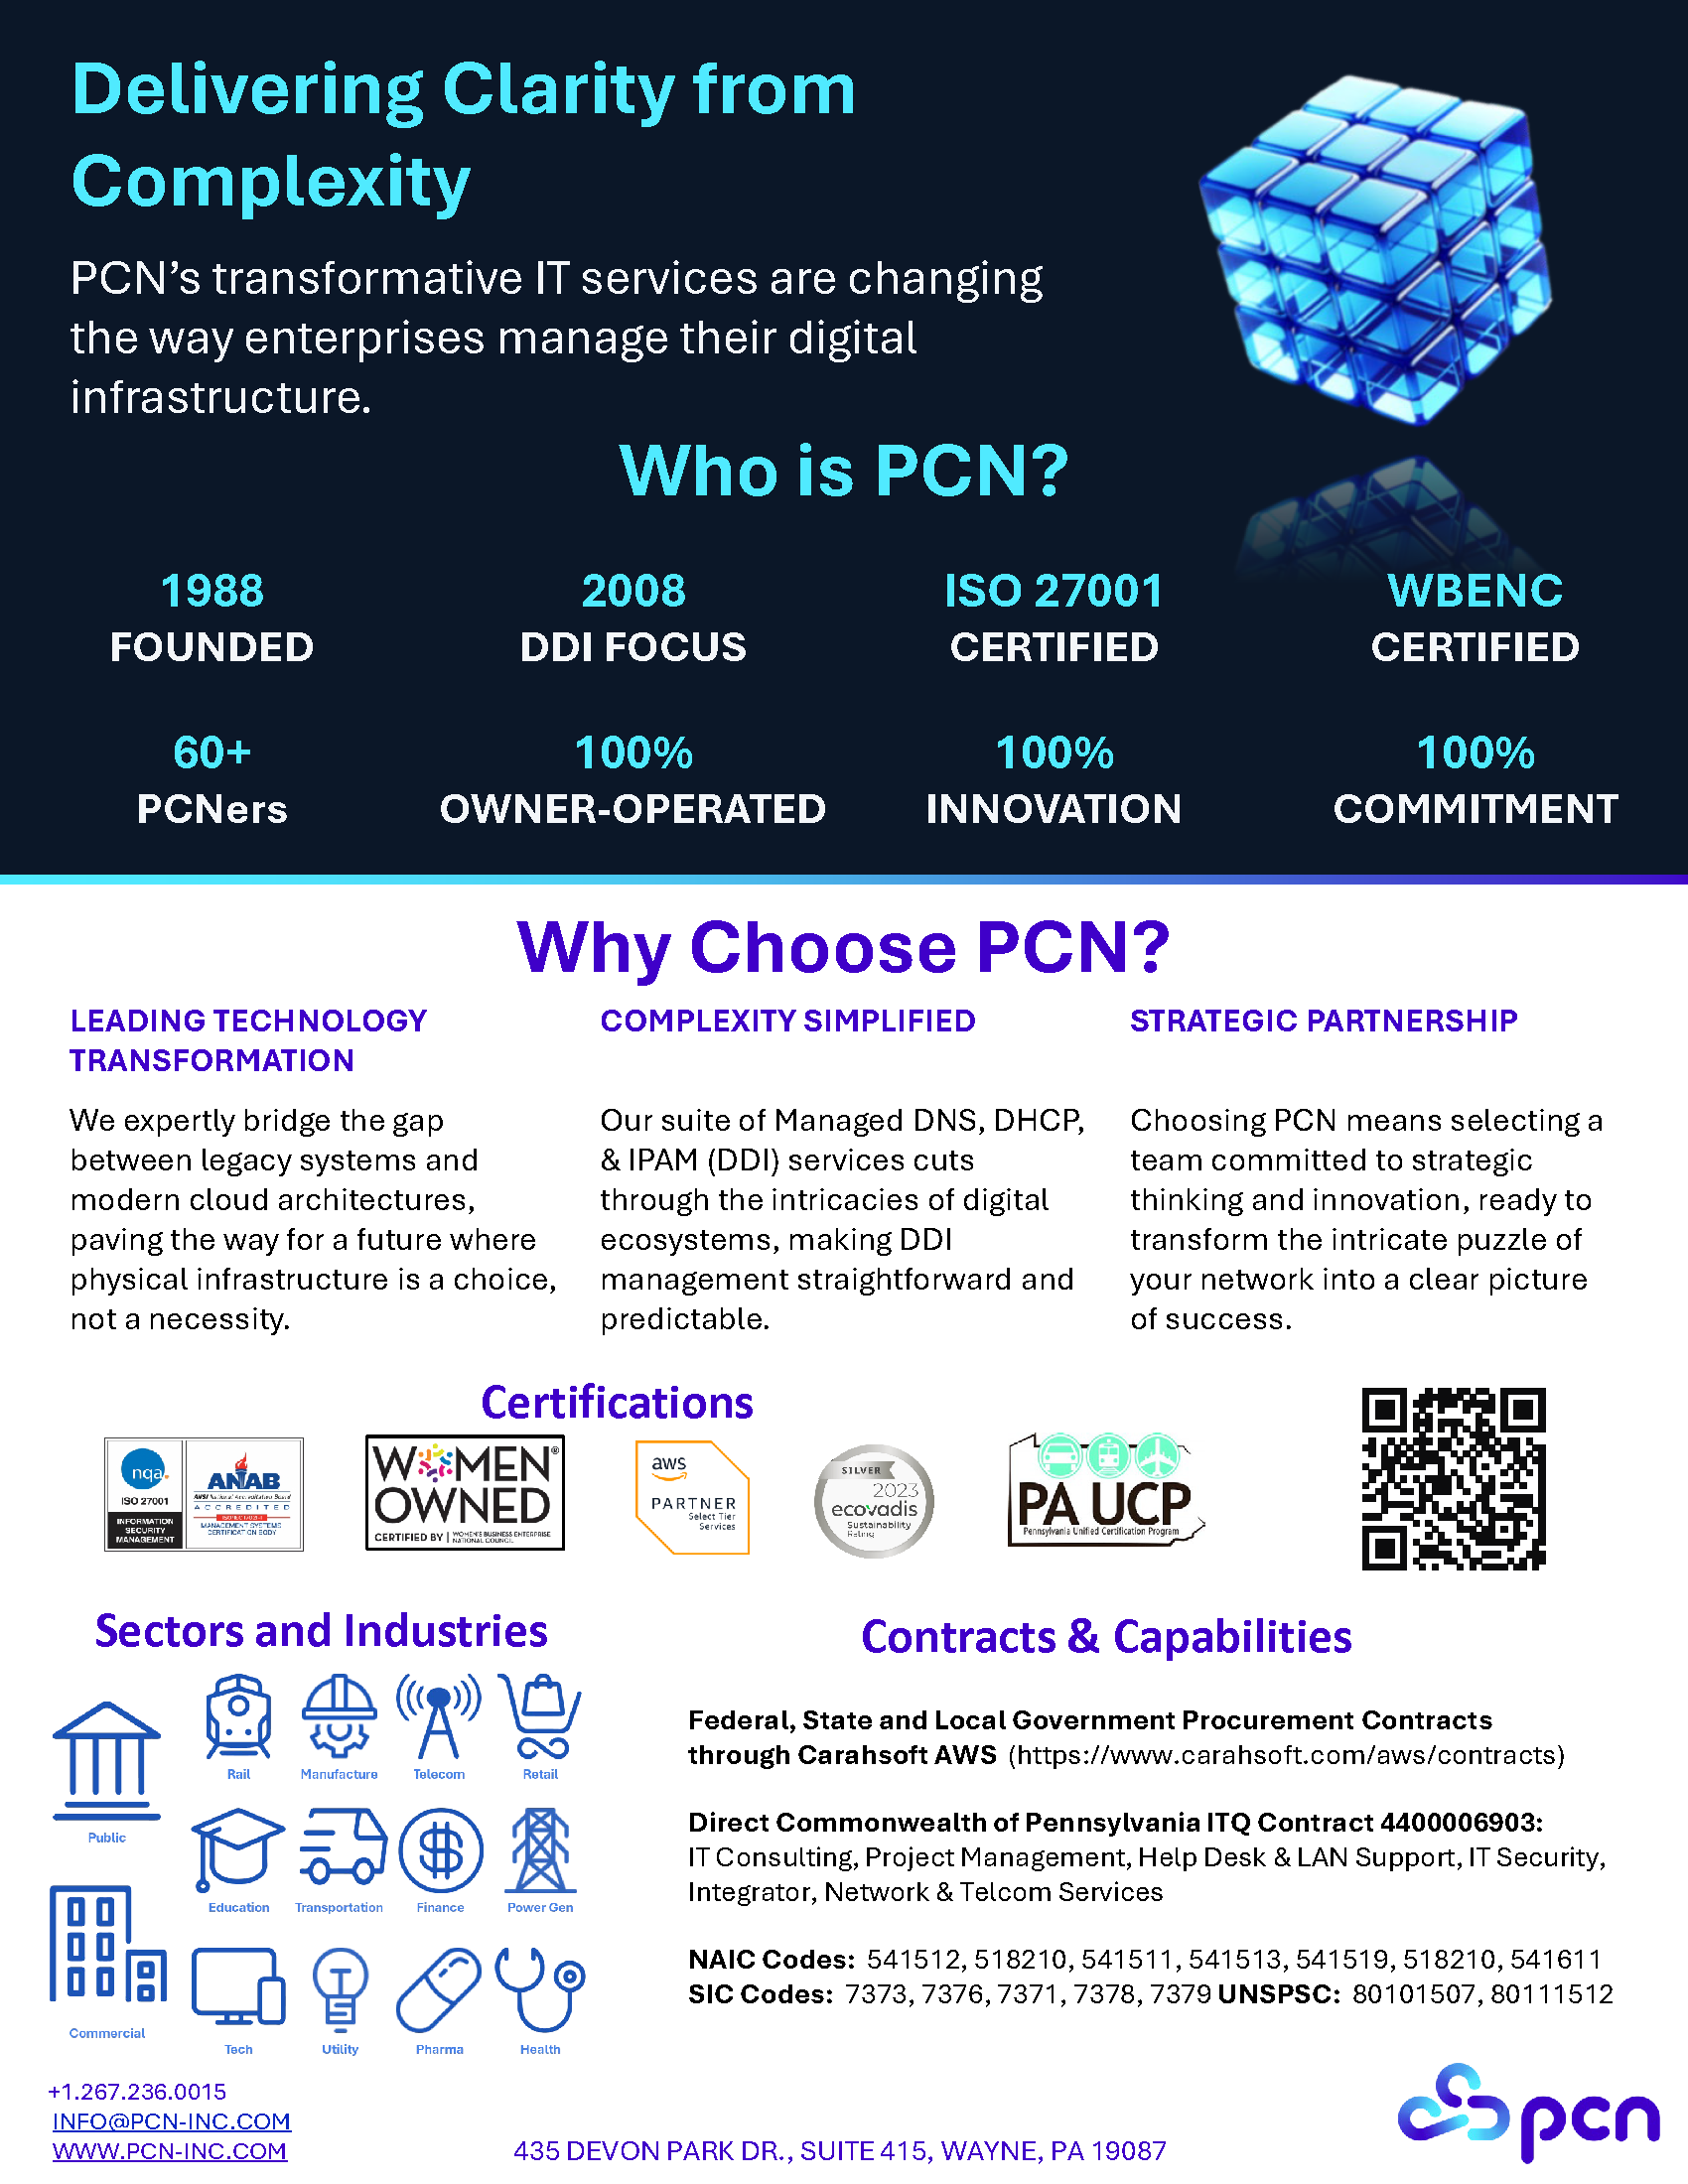
Capabilities Statement

ClearSky DDI

MDDI
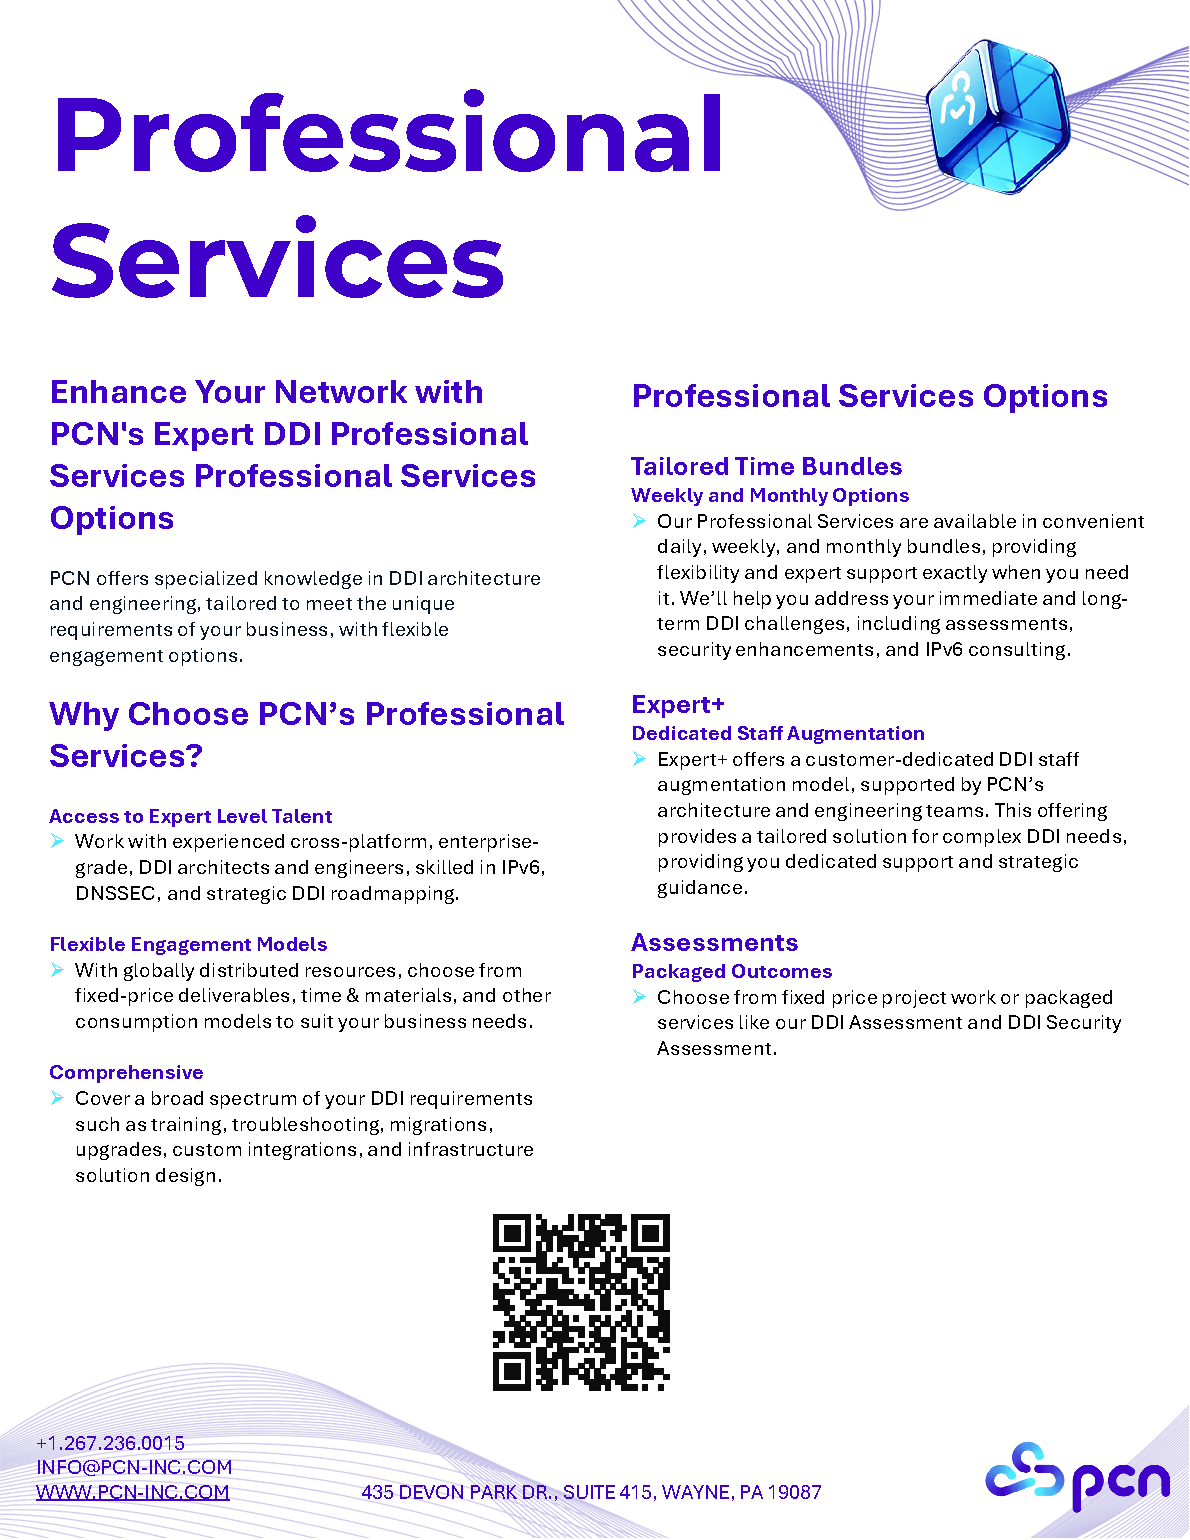
PS
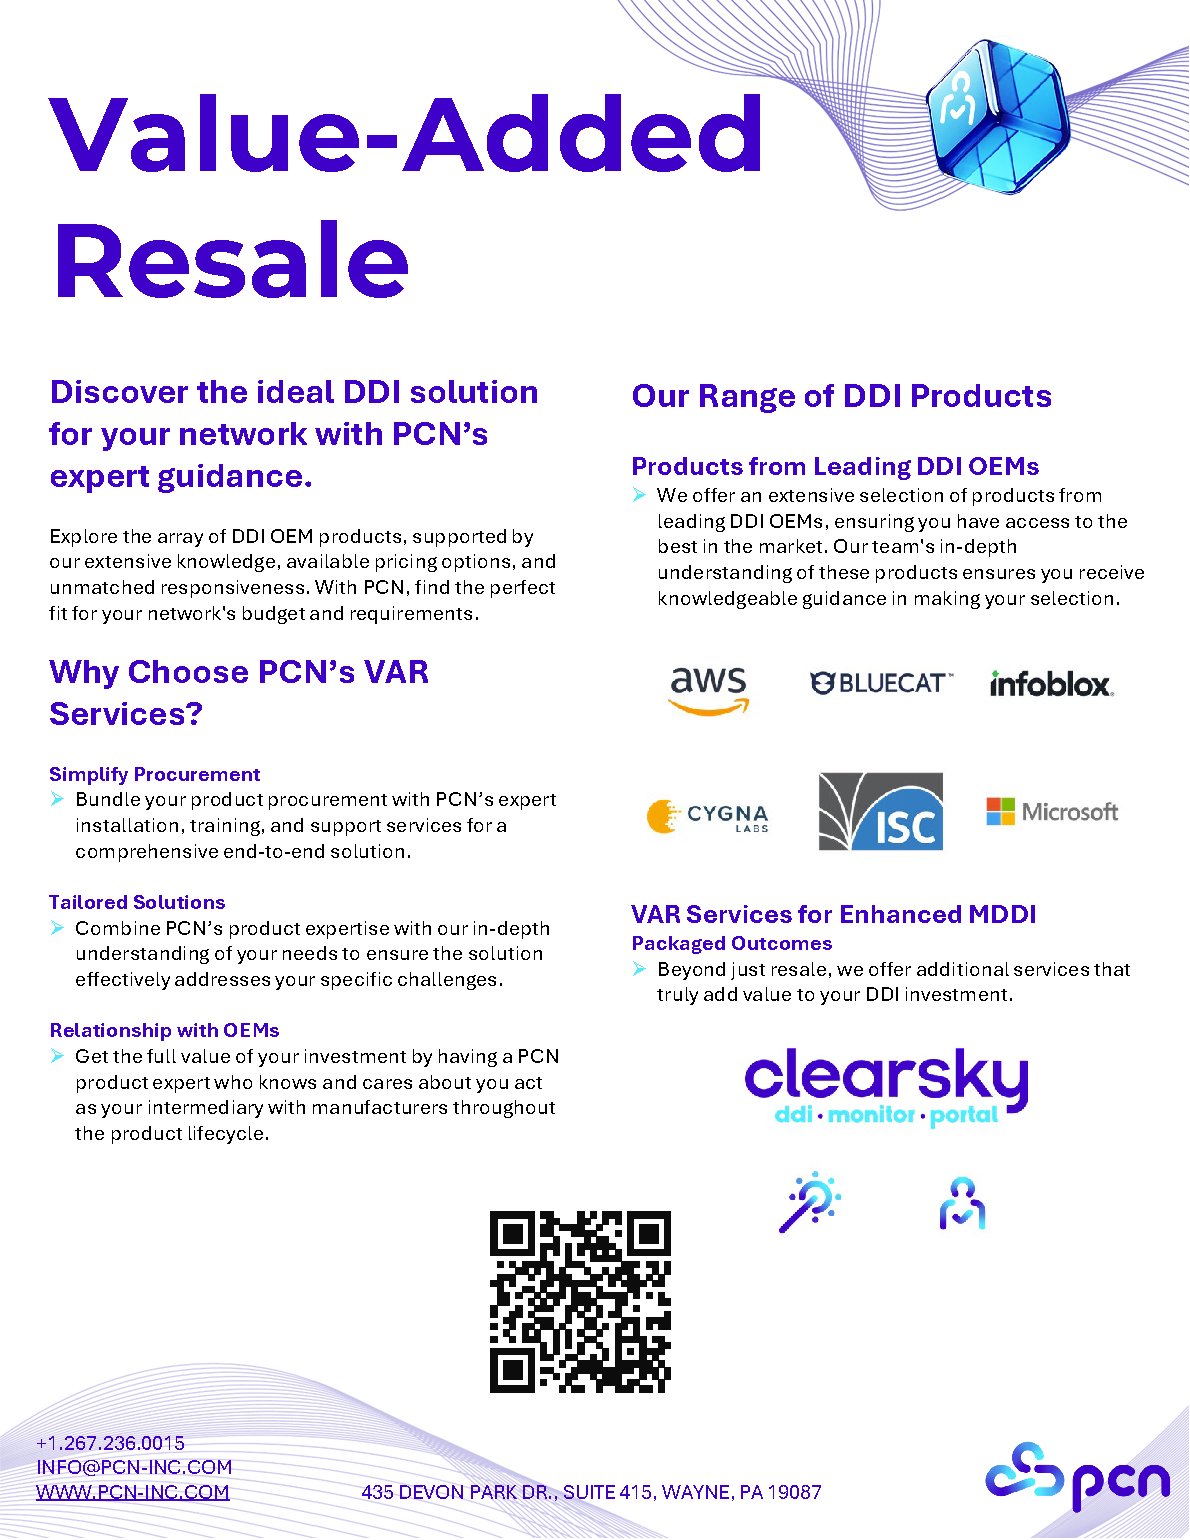
VAR
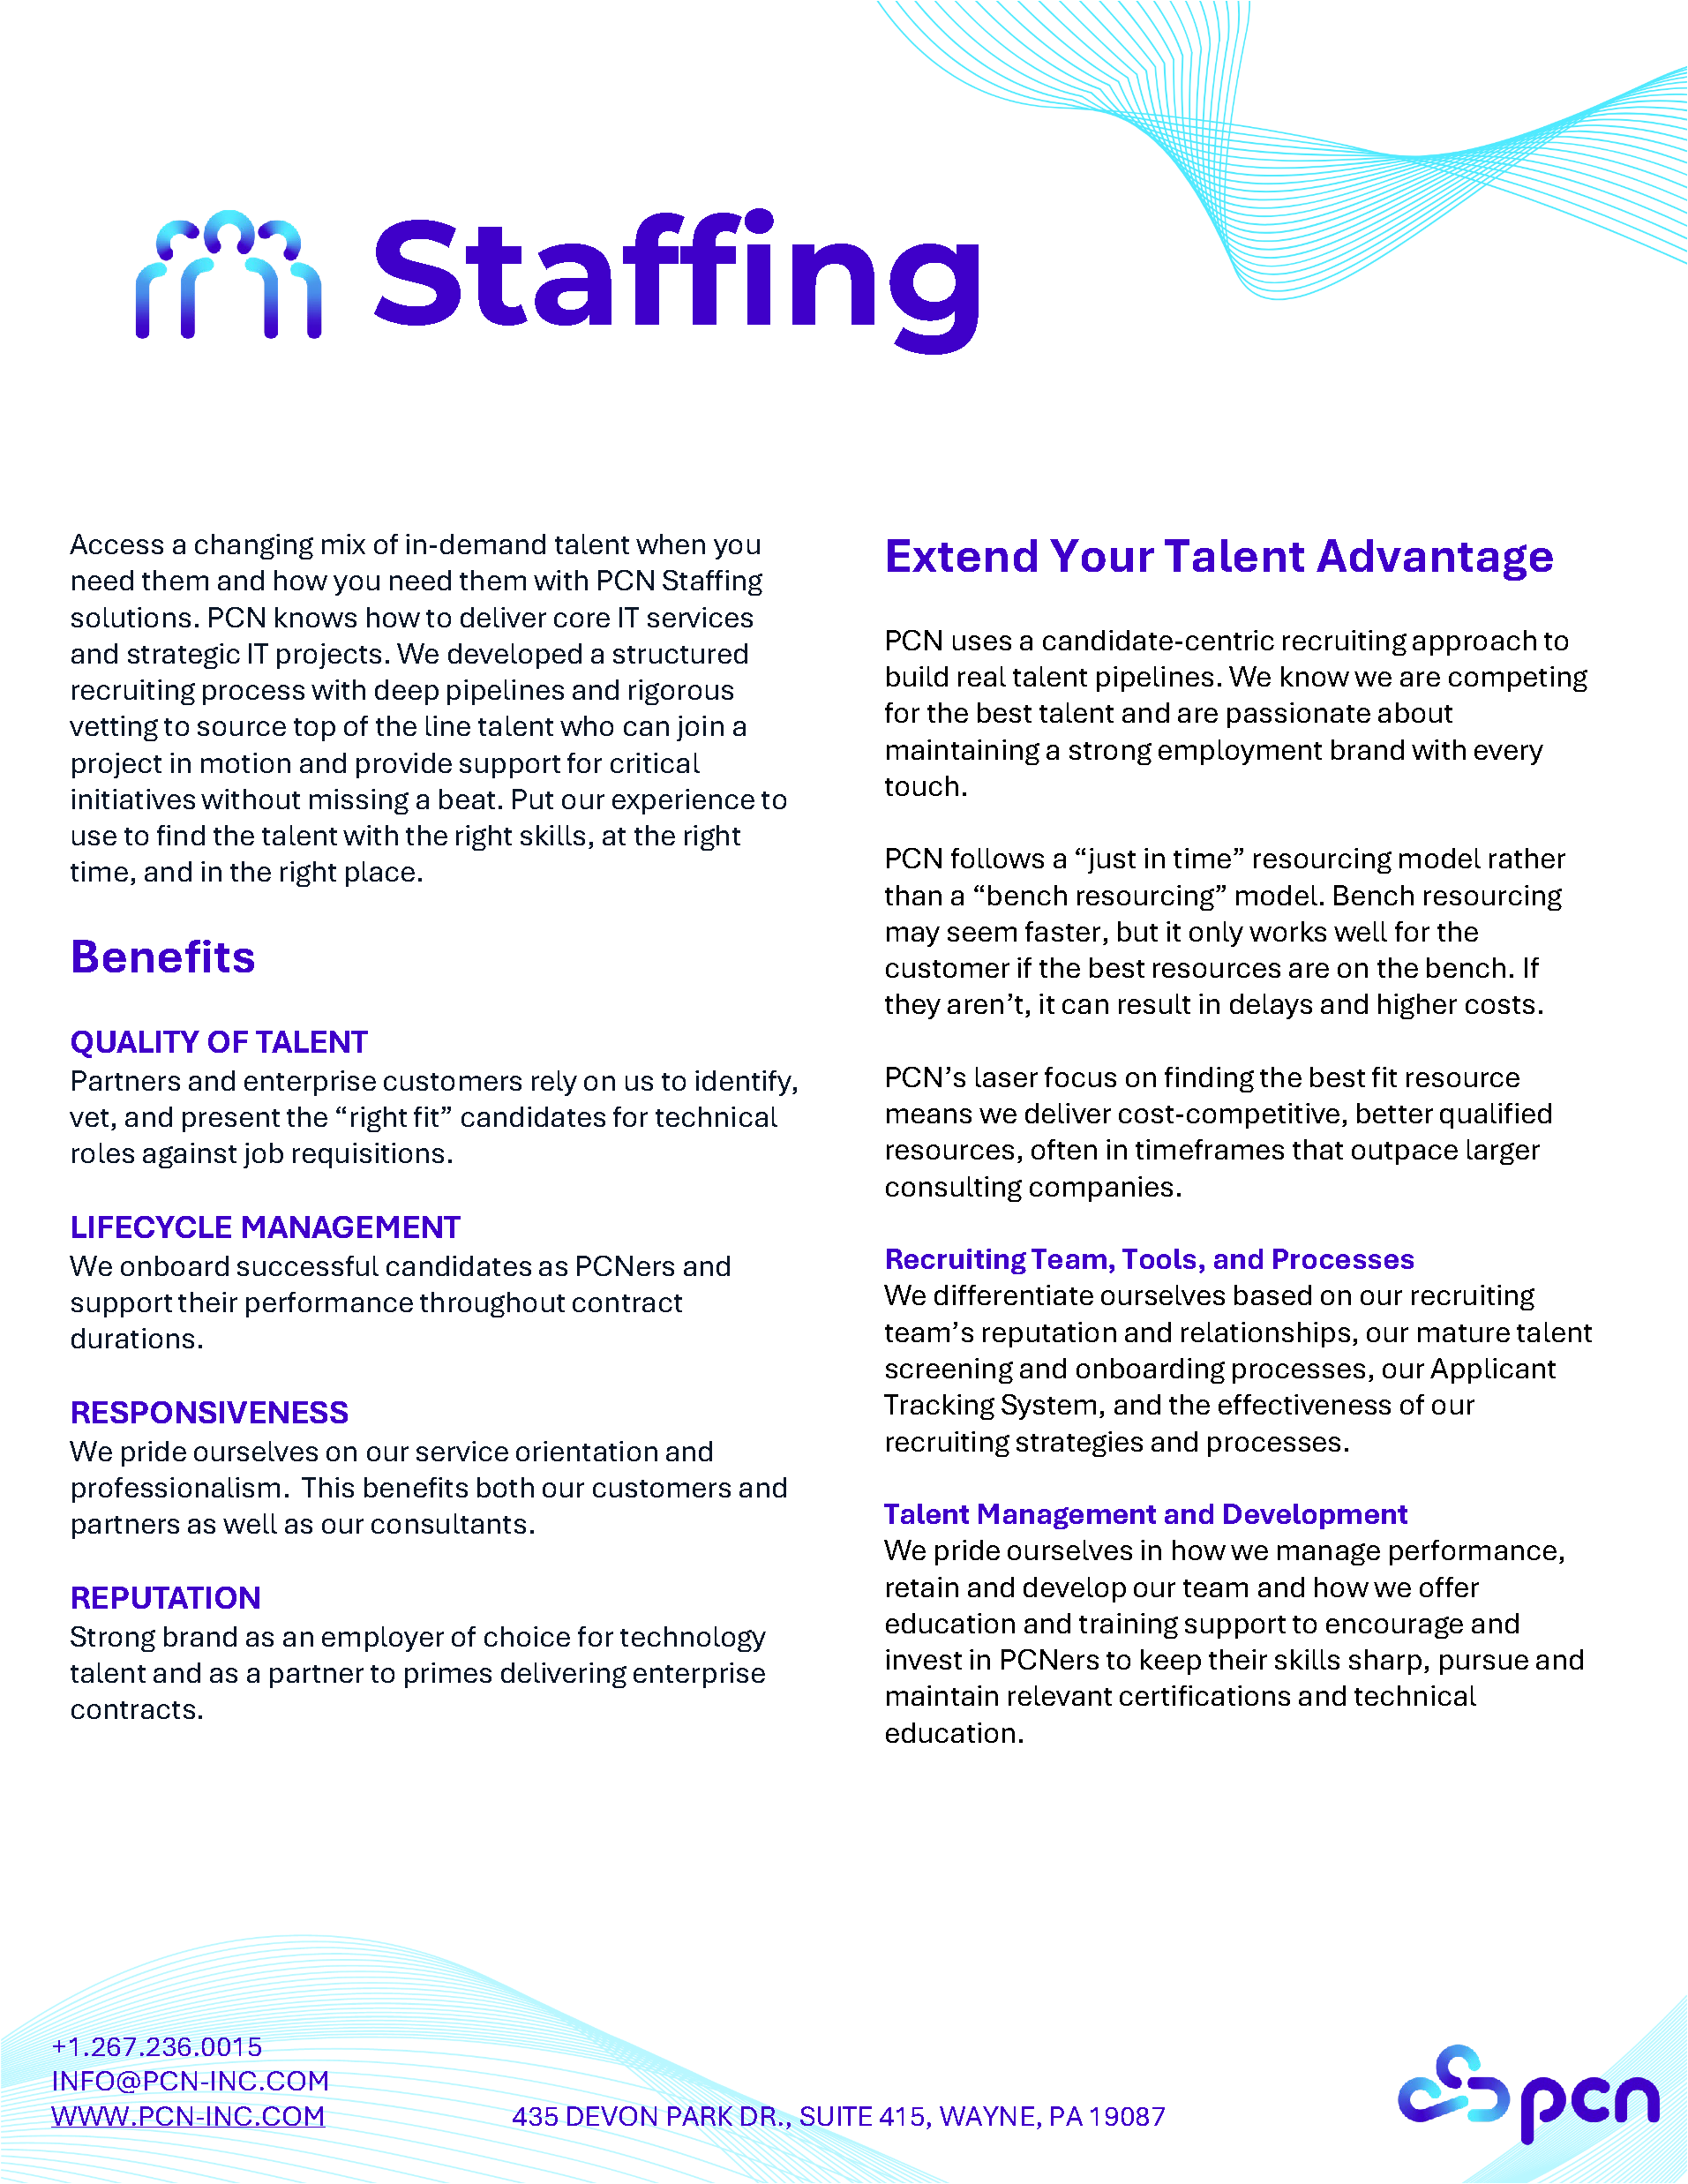
Staffing

Service Desk
Security
